At-a-glance view showing differences in the three states of ENSO (El Niño Southern Oscillation). Top maps represent sea surface temperatures in the equatorial Pacific, bottom maps represent the sea surface temperature anomaly for the same location.
Cross-section view of the northern hemisphere atmospheric circulation cells with notations marking the location of the jet streams.
Cross-section view of atmospheric isobars in the southern hemisphere and an indication of the pressure gradient force (black arrow), Coriolis force (orange arrow), and the direction of the resulting jet stream (circle with X representing movement into the page)
Cross-section view of oceanic isobars in the northern hemisphere and an indication of the pressure gradient force (black arrow), Coriolis force (orange arrow), and the direction of the resulting gyre circulation (circle with X representing movement into the page in the west, and a circle with a dot representing movement out of the page in the east))
Map view of the forces causing equa
Sketch showing how to read a hydrometer in a lab manual exercise.
Lab manual exercise to contour isotherms on a depth transect.
Lab manual exercise to contour sea surface temperature anomalies to demonstrate the ENSO cool phase (La Niña)
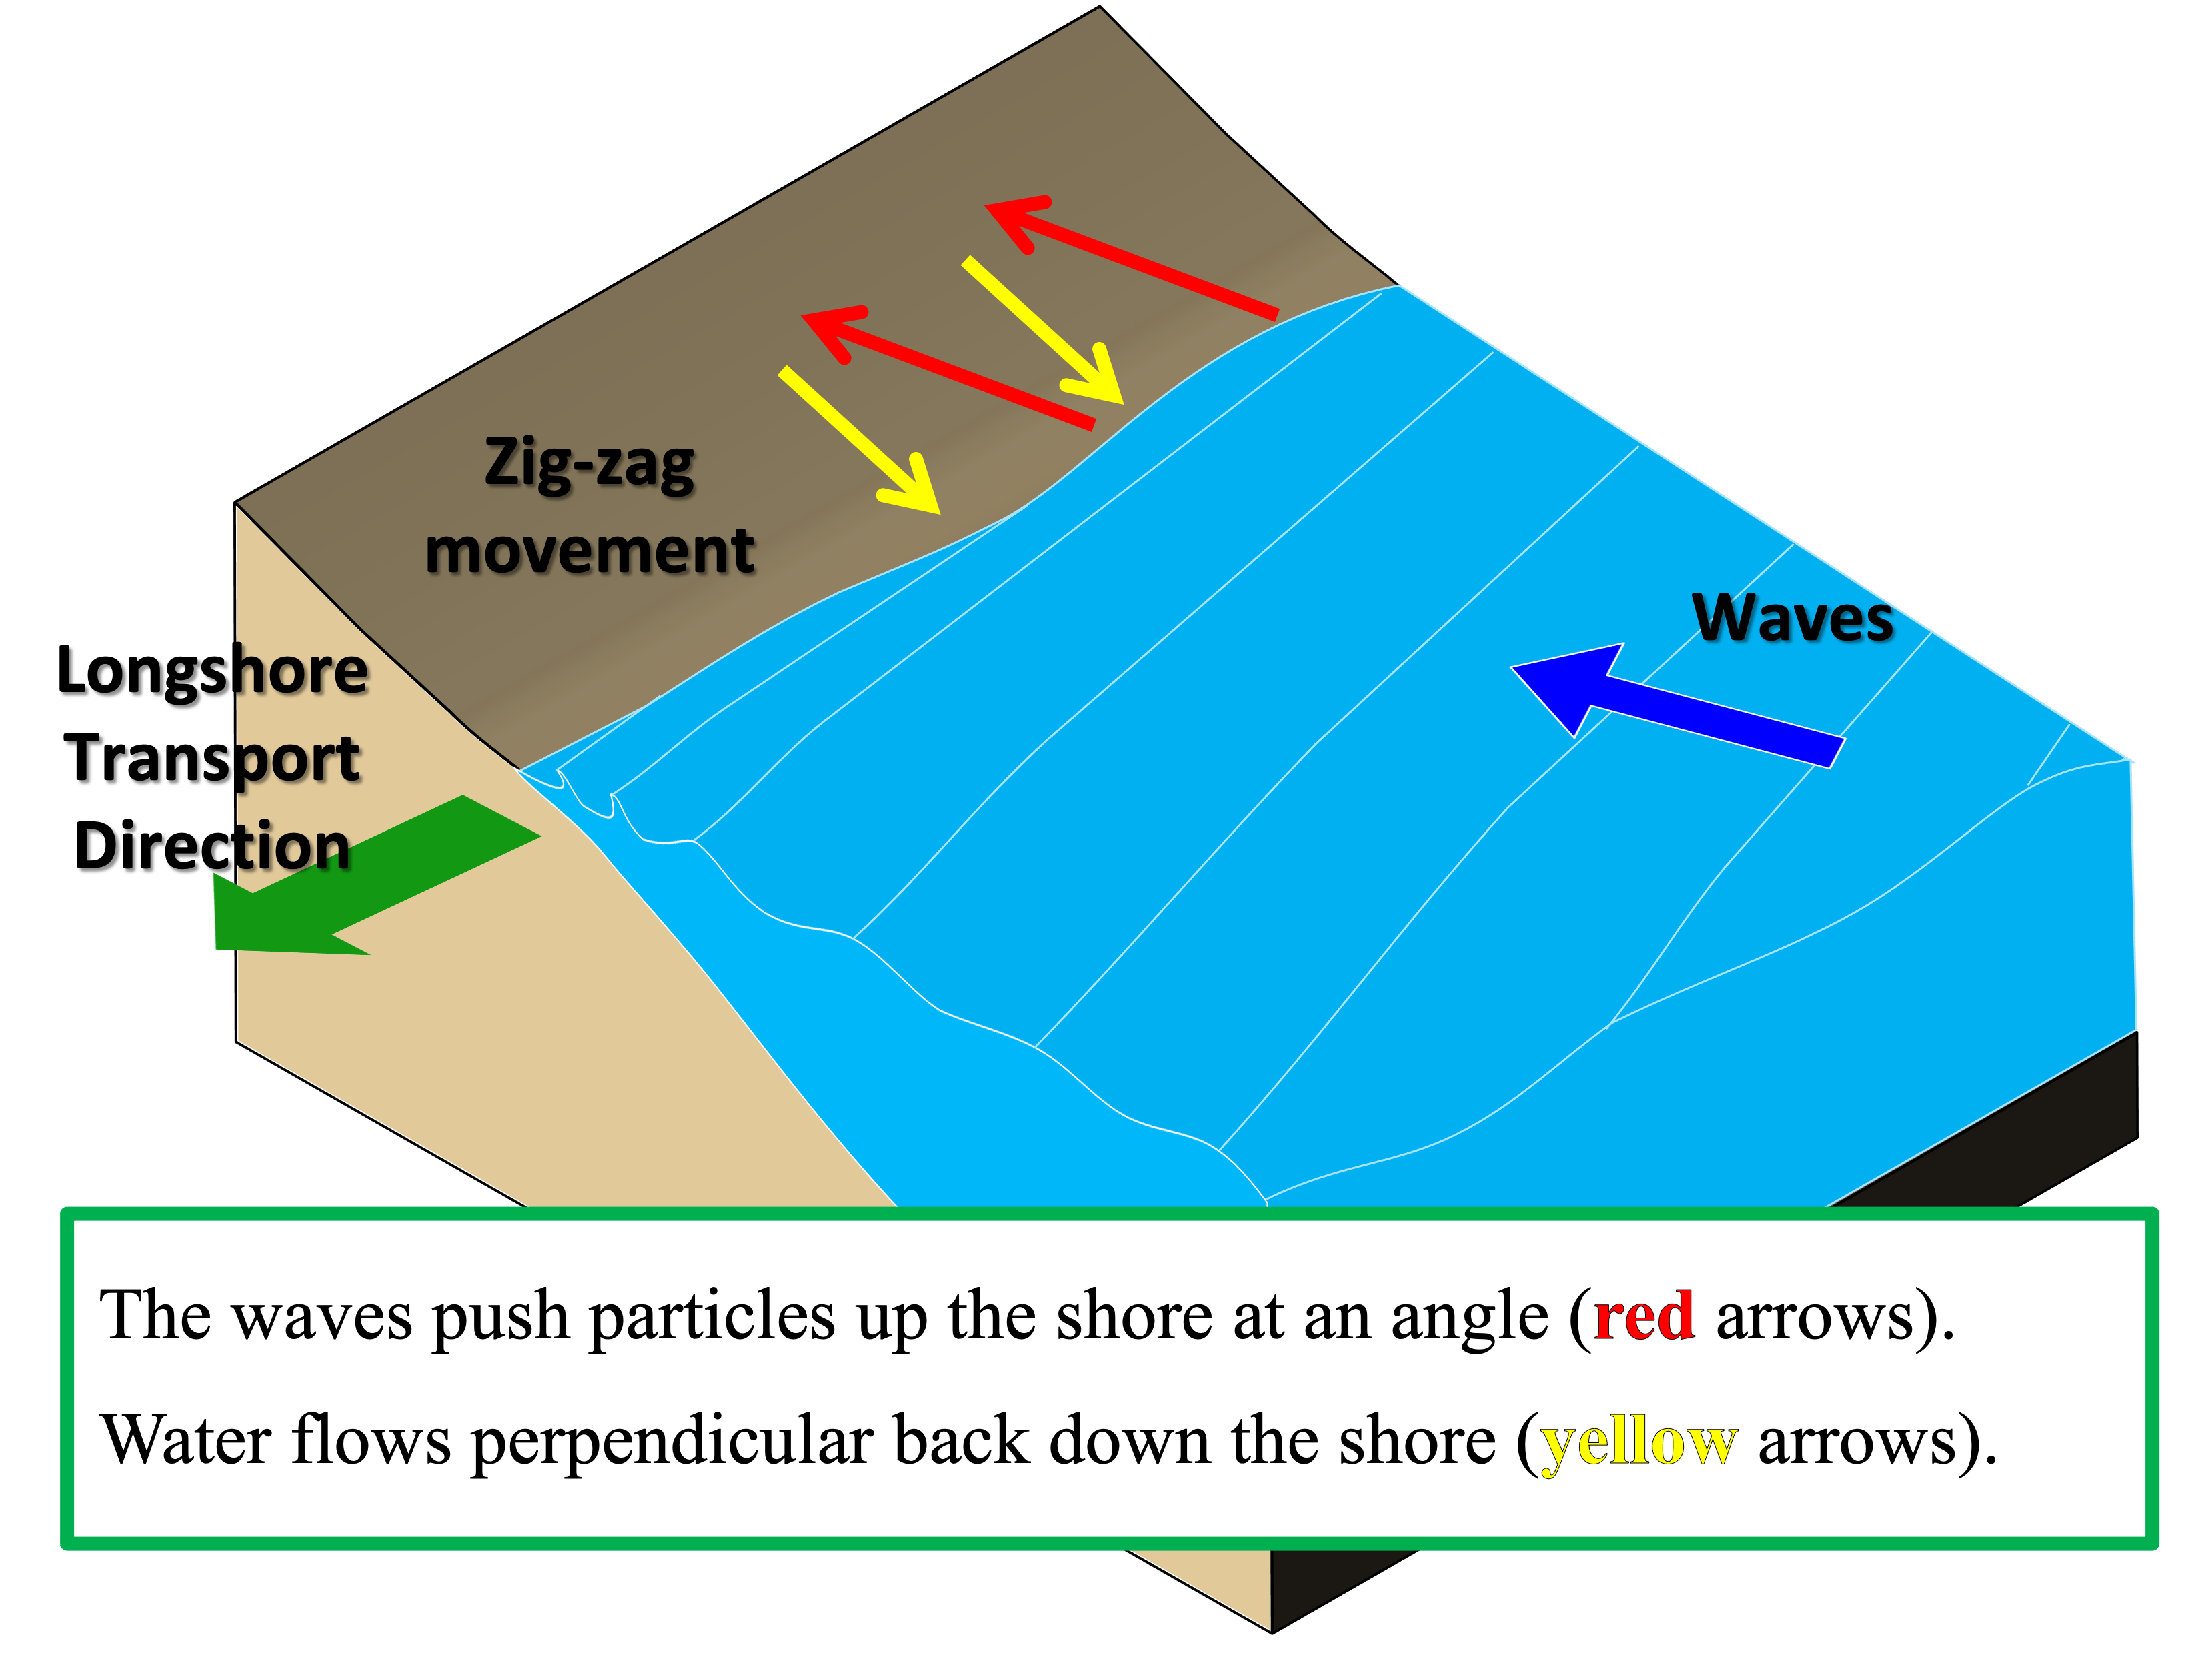
Lab manual figure for a field trip showing a sketch of the coastline with names for surf breaks labeled next to piers, groins, and the jetty.